Research Article | | Peer-Reviewed

Comparative Transcriptomics Reveals the Molecular Mechanism Underlying Heavy Metal Detoxification in Aspergillus Niger

Received: 30 December 2025     Accepted: 15 January 2026     Published: 11 February 2026
Views:       Downloads:
Abstract

Aspergillus niger shows resistance to Zn and Cu; however, limited studies have evaluated the genetic mechanisms underlying metal tolerance in the species. In this study, comparative transcriptome analyses of A. niger F2 under Zn (4000 mg/L) and Cu (3000 mg/L) stress for 15 days were performed to identify genes involved in the response to heavy metal stress. There were more upregulated than downregulated genes under both Cu and Zn stress; however, more genes were differentially expre ssed under Cu than under Zn stress. Downregulated genes under Zn stress were enriched mainly in the membrane part of the cellular component category and for catalytic activity of ribonucleases in the molecular function category. Downregulated genes under Cu stress were enriched for import of Cu ions in the biological process category, intrinsic membrane in the cellula r component category, and reductase and oxidoreductase activity in the molecular function category. Differentially express ed genes under Zn and Cu stress were enriched for different functional domains based on Gene Ontology and Kyoto Ency clopedia of Genes and Genomes analyses. These findings indicated that under heavy metal stress, downregulated genes are mainly involved in ion transport and cell membrane-related functions. Furthermore, energy consumption was higher under Cu stress than under Zn stress, contributing to differences in tolerance levels for A. niger. These findings provide a b asis for genetic engineering for efficient bioremediation.

Published in American Journal of Environmental Science and Engineering (Volume 10, Issue 1)
DOI 10.11648/j.ajese.20261001.11
Page(s) 1-20
Creative Commons

This is an Open Access article, distributed under the terms of the Creative Commons Attribution 4.0 International License (http://creativecommons.org/licenses/by/4.0/), which permits unrestricted use, distribution and reproduction in any medium or format, provided the original work is properly cited.

Copyright

Copyright © The Author(s), 2026. Published by Science Publishing Group

Keywords

Aspergillus, Differential Gene Expression, Heavy Metal Stress, Microbial Transcriptome

1. Introduction
The fungal genus Aspergillus is frequently used for the development of microbial cell factories owing to its diverse metabolites and specific mycelial structure. It is used to produce organic acids, proteins, and new bioactive secondary metabolites . Species in the genus show strong resistance to heavy metals and are used as adsorbents and extracting agents for environmental control . For example, Aspergillus niger has been used as an adsorbent for lead (Pb), cadmium (Cd), and copper (Cu) and for pigments . The main biosorption mechanisms in A. niger are ion exchange, electronic attraction, and complexation (involving C=C, C-H, C-O, and N-H) . Metals are bioleached by A. niger from various substrates; the species has been used to bioleach valuable metals from spent catalysts, computer printed circuit boards, and lithium-ion mobile phone batteries . Scandium has been bioleached from bauxite residue while iron impurities have been bioleached from kaolin using A. niger . Additionally, heavy metals have been bioleached from contaminated soil using A. niger . The main bioleaching mechanisms for A. niger F2 include acidolysis, complexolysis (generation of organic acids), redoxolysis, and bioaccumulation .
Transcriptomics can improve our understanding of cell metabolism in polluted environments. In particular, transcriptome technology can rapidly predict relevant defense factors under stress and reveal relationships between metabolic pathways, signal transduction, and defense responses, providing a basis for improving microbial stress resistance and understanding the detoxification mechanisms under heavy metal stress . In an early study, the structure and composition of the transcriptomes of two Prochlorococcus strains with a gene pool adapted to a specific environment were compared, revealing antisense transcription for 3/4 of all genes, hundreds of transcription start sites within genes with very little conservation, and non-coding transcripts differing between strains . In Stenotrophomonas rhizophila, comparative transcriptomics analyses have revealed that pbt is responsible for adsorbing Pb2+, phosphate permease is involved in the Pb2+ response, and czcA/cusA or Co2+/Mg2+ efflux proteins contribute to the efflux of Pb2+ . The impact of cadmium on Bacillus subtilis biofilms, morphology, and function was evaluated by transcriptomics. The main regulator of biofilm formation, Spo0A, decreased under Cd ion stress, inhibiting extracellular polysaccharide synthesis and the AbrB pathway. Cd ion treatment also increased the SigD content and expression levels of flagella-encoding and assembly genes in the strain .
Recent research on the transcriptome of Aspergillus niger has been aimed at improving enzyme production . Wang et al. developed a sucrose-inducible expression system based on the PfopA promoter and A. niger ATCC 20611. The system was successfully used to produce the monoenzyme β-glucosidase and a chitin-degrading enzyme cocktail including chitinase Chi46 and GlcNAcase NAG1 at high levels. The fermentation broths of recombinant strains can be directly applied to the substrate without additional purification, enabling efficient and cost-effective biomass degradation . Additionally, studies have focused on characterizing transcriptional profiles under different conditions . In A. niger, the transcriptional response to 6 h of exposure to wheat straw differed significantly from the response to 24 h of exposure to the same substrate, as determined using RNA sequencing . In an analysis of spore germination, Novodvorska et al. found that the transcriptome of dormant conidia was highly differentiated from that of germinating conidia, and major changes in response to an environmental shift occurred within the first hour of germination.
Detoxification mechanisms in microorganisms enable survival in environments polluted with heavy metals. These mechanisms include extracellular sequestration, redox transformation, efflux systems, methylation and volatilization, and biofilm collaborative defense. Extracellular sequestration is achieved by the adsorption or chelation of secreted extracellular polymers of heavy metals, cell surface adsorption, and mineral precipitation. Intracellular detoxification is achieved by chelating heavy metal ions with small proteins rich in sulfhydryl groups (-SH), such as metallothionein (MTs), glutathione, and phytochelin (PCs), to form non-toxic complexes and transporting heavy metals to specific cellular compartments (such as vacuoles) for isolation through metallochaperone proteins (e.g., yeast YCF1 transports the Cd-GSH complex to the vacuole). The REDOX pathway changes the valence state of heavy metal ions. Heavy metals with high toxicity are reduced to those with low toxicity or to easy precipitation valence states through REDOX enzymes (e.g., Hg2+ is reduced to Hg0, Cr6+ to Cr3+, and As5+ to As3+). The main proteins involved in active efflux are ATPase pumps (P-type ATPases), CDF family proteins (ZnT), and RND family proteins. Bacterial CadA depends on ATP to discharge Cd2+, Pb2+, etc. ZnT transfers Zn2+ and Cd2+ to extracellular compartments or vacuoles, and the Cus system of Escherichia coli removes Cu+/Ag+. Methylation products, such as As methyltransferase in fungi, can translate As3+ into methylarsenic and some volatile products, such as dimethylselenium and dimethylmercury. Biofilm cooperative defense mechanisms include group protection and microenvironmental regulation. Microorganisms enhance the overall resistance via shared extracellular polymeric substances and lateral transfer of resistance genes to achieve population protection. Reductive environments in biofilms promote the precipitation of heavy metals (e.g., Fe3+ to Fe2+) to achieve microenvironmental regulation. Research on the mechanisms underlying microbial detoxification of heavy metals can provide guidance for bioremediation, as resistant or genetically engineered bacteria have been used to treat contaminated soil/water, and for environmental monitoring through the design of biosensors using microbial heavy metal response genes, such as meroperons.
Heavy metals are bioaccumulative, non-degradable, and not environmentally durable, and their toxic effects occur at low concentrations, Zn and Cu are common heavy metals present in the polluted soil of mines. Although various mechanisms thro ugh which microbes counter heavy metal toxicity have been determined , little is known about the gene expression in A. niger under heavy metal stress from the perspective of transcriptomics. Thus, in this study, based on the strong tolerance of A. niger to Zn and Cu , a transcriptome approach was used to elucidate the molecular mechanisms contributing to the res ponses to Zn and Cu exposure in A. niger. This study serves to identify genes involved in heavy metal tolerance in fungal c ells and to provide a scientific basis for the construction of an engineered strain.
2. Materials and Methods
2.1. Culture Under Heavy Metal Stress and Transcriptome Sequencing
Liquid media were prepared as described by Deng et al. . A spore suspension (1 mL) was cultured in 49 mL of liquid medium, the spores were harvested from the solid medium, and 15 samples were prepared and divided into three groups: 4000 mg/L Zn was added to group A, 3000 mg/L Cu was added to group B, and no heavy metal was added to group C. Each group consists of 3 repetitions. All samples were cultured for 15 days and then filtered. Mycelia were collected in a freezing tube, f rozen in liquid nitrogen for 30 min, preserved in a refrigerator, and sent to Sangon Biotech (Shanghai) Co., Ltd. for tra nscriptomic sequencing (no reference genome). The mRNA library was constructed using the VAHTS™ mRNA-seq V2 Librar y Prep Kit for Illumina® (Nanjing Novizan), and the library was detected through 8% PAGE. The recycled DNA was accurate ly quantified using a Qubit2.0 DNA Detection Kit, made in Thermo Fisher Scientific, mixed at a ratio of 1:1, and sequenced.
2.2. Analysis of Transcriptome Sequencing Data
Illumina HiSeq™ raw image data files were analyzed using CASAVA Base Calling and converted to raw reads/raw data. Clean reads were obtained by removing reads with joints, with an N ratio of >5%, or with a mean quality <20. The quality control results are shown in Table 1. Overlapping reads were assembled into fragments using Trinity software (version 2.4.0) and further assembled into unigenes. Unigenes were also checked for redundancy and further spliced using Tgicl software (v2.0.6).
Table 1. Quality control data for all samples.

Item

A1

A2

A3

B1

B2

B3

C1

C2

C3

Total Read Count (bp)

5346231

6

5658057

4

5825071

4

6030647

6

5016544

2

6225423

4

5991535

0

37981956

4581877

0

Total Base

7799922

8232441

8539144

8842535

7338665

9109868

8757236

55362377

6765581

Count (bp)

526

426

295

892

769

248

715

77

236

Average Read Length (bp)

145.9

145.5

146.59

146.63

146.29

146.33

146.16

145.76

147.66

Q10 Base

7799861

8232377

8539079

8842468

7338608

9109793

8757168

55362202

6765527

Count (bp)

752

865

954

564

593

657

882

13

775

Q10 Base Ratio (%)

100.00%

100.00%

100.00%

100.00%

100.00%

100.00%

100.00%

100.00%

100.00%

Q20 Base

7753259

8179973

8484155

8789274

7292127

9053973

8704413

54689303

6719240

Count (bp)

917

542

171

716

824

516

955

25

496

Q20 Base Ratio (%)

99.40%

99.36%

99.36%

99.40%

99.37%

99.39%

99.40%

98.78%

99.32%

Q30 Base

7594334

8003589

8297975

8607326

7135848

8862789

8522612

52872151

6562816

Count (bp)

688

983

402

410

373

155

759

47

477

Q30 Base Ratio (%)

97.36%

97.22%

97.18%

97.34%

97.24%

97.29%

97.32%

95.50%

97.00%

N Base Count (bp)

60774

63561

64341

67328

57176

74591

67833

17564

53461

N Base Ratio (%)

0.00%

0.00%

0.00%

0.00%

0.00%

0.00%

0.00%

0.00%

0.00%

GC Base

4411946

4618611

4763806

4963075

4036200

5080221

4790932

30397402

3699814

Count (bp)

663

250

026

619

979

015

607

85

435

GC Base Ratio (%)

56.56%

56.10%

55.79%

56.13%

55.00%

55.77%

54.71%

54.91%

54.69%

The transcripts were blast-searched using NCBI Blast+ against the following databases to acquire the functional annotation information: Eukaryotic Orthologous Groups (KOG), Swiss-Prot, TrEMBL, CDD, Gene Ontology (GO), and Kyoto Encyclopedia of Genes and Genomes (KEGG) (e-value < 0.00001). Annotation information was obtained from GO, SWISS- PROT, and TrEMBL. An automatic annotation server was used to obtain annotation information using KEGG. CDS prediction was carried out through comparisons using the BLAST database and TransDecoder. The valid data for the samples were compared with the transcripts obtained by splicing using Bowtie2, and mapping information was calculated. RSeQC was used to analyze redundant sequences and insert fragment distributions based on the comparison results. BEDTools was used to evaluate homogeneity and gene coverage. Salmon was used to calculate gene expression, represented by transcripts per million reads (TPM). The DESeq2 model was used to select differentially expressed genes (q < 0.05 and |FoldChange| > 2) . For visualization, a scatter diagram was drawn based on the results of DEG screening. ClusterProfiler was used for KEGG pathway and KOG classification enrichment analyses. An association analysis network was drawn based on the results of the functional enrichment analysis.
2.3. Verification Through Quantitative Real-Time Polymerase Chain Reaction (qRT-PCR)
For verification, quantitative real-time polymerase chain reaction (qRT-PCR) was perfomed by the Wuhan Institute of Biotechnology. In particular, 28 genes were selected for verification using the BIO-RAD CFX Connect™ Fluorescence Quantitative PCR Detection System and Power SYBR® Green PCR Master Mix (Applied Biosystems® Cat: 4367659). The same RNA samples were used for Illumina library synthesis and qRT-PCR verification. The specific primers used for qRT-PCR are listed in Additional File 1, and actin and β-tubulin were used as endogenous controls. Relative gene expression was analyzed using the comparative threshold (CT) cycle method established by Livak & Schmittgen .
First, the CT value for the target gene was normalized to that of the reference gene (ref) for both test and calibrator samples as follows:
⊿CT (test) = CT (target, test) – CT (ref, test)
⊿CT (calibrator) = CT (target, calibrator) – CT (ref, calibrator)
Second, the ⊿CT value for the test sample was normalized to the ⊿CT value for the calibrator: ⊿⊿CT =⊿CT (test) –⊿CT (calibrator)
Finally, the expression ratio was calculated as follows: 2–⊿⊿CT = Normalized expression ratio
3. Results and Dicussion
3.1. Transcriptome Profiles and Splicing Under Zn and Cu Stress
After quality control, 183324 transcripts and 90345 unigenes were assembled. The maximum length of transcripts or unigenes was 16168 base pairs (bp), minimum length was 201 bp, and average transcript lengths were 1607.79 bp and 836.17 bp for unigenes (Table 2). The mapping ratios for all samples exceeded 97%, and the average ratios of multiply mapped samples were 81.61% for samples under Zn stress, 80.27% for samples under Cu stress, and 82.91% for control samples. The average ratios of uniquely mapped reads were 16.21% for samples under Zn stress, 17.35% for samples under Cu stress, and 14.70% for controls (Table 3). Regarding coverage, 8393, 9450, and 7573 genes showed values between 90% and 100% for samples under Zn stress, 20254, 11094, and 14889 genes were between 90% and 100% for samples under Cu stress, and 8575, 4788, and 14245 genes were between 90% and 100% for controls (Table 4). These findings indicated that transcriptome sequencing and splicing results for A. niger were accurate and reliable.
Table 2. Assembly results.

Item

No.

≥500 bp

≥1000 bp

N50

N90

Max Length (bp)

Min Length (bp)

Total Length (bp)

Average Length (bp)

Transcript

183324

108547

83291

3263

719

16168

201

294746548

1607.79

Unigene

90345

32441

20933

1876

263

16168

201

75544213

836.17

Table 3. Mapping results for Aspergillus niger.

Item

A1 (%)

A2 (%)

A3 (%)

B1 (%)

B2 (%)

B3 (%)

C1 (%)

C2 (%)

C3 (%)

Total reads

100.00

100.00

100.00

100.00

100.00

100.00

100.00

100.00

100.00

Total mapped

97.71

97.85

97.88

97.92

97.12

97.82

97.56

98.04

97.22

Multiple mapped

81.00

81.72

82.10

79.89

81.17

79.74

83.55

83.58

81.60

Uniquely mapped

16.71

16.13

15.78

18.04

15.95

18.07

14.01

14.46

15.62

Read-1 mapped

8.36

8.07

7.89

9.02

7.98

9.04

7.01

7.23

7.81

Read-2 mapped

8.35

8.06

7.89

9.02

7.97

9.04

7.00

7.23

7.81

Reads map to ‘+’

8.35

8.07

7.92

9.02

8.00

9.03

7.03

7.25

7.85

Reads map to ‘- ’

8.36

8.05

7.86

9.02

7.95

9.04

6.98

7.21

7.77

Non-splice reads

16.71

16.13

15.78

18.04

15.95

18.07

14.01

14.46

15.62

Splice reads

0.00

0.00

0.00

0.00

0.00

0.00

0.00

0.00

0.00

Reads mapped in proper pairs

15.41

14.85

14.71

16.79

14.74

16.71

12.96

13.55

14.51

Table 4. Coverage of genes.

Item

A1

A2

A3

B1

B2

B3

C1

C2

C3

0%−10%

59188

57630

60157

44930

50771

43478

66913

71249

57765

10%−20%

1750

1093

1519

1897

1033

1547

561

2164

653

20%−30%

2006

1737

2045

1969

1784

2185

1022

1542

978

30%−40%

2292

2202

2198

2072

2691

2863

1306

1372

1395

40%−50%

2662

2638

2581

2357

3771

3638

1831

1421

2032

50%−60%

3036

3051

3091

2923

4323

4537

2179

1506

2760

60%−70%

3447

3553

3454

3605

5139

5113

2344

1644

3347

70%−80%

3494

3859

3658

4290

4871

5539

2522

1926

3429

80%−90%

4077

5132

4069

6048

4868

6556

3092

273

3741

90%−100%

8393

9450

7573

20254

11094

14889

8575

4788

14245

Note: A represents samples under Zn stress, B represents samples under Cu stress, and C represents the control
3.2. Screening and Annotation of Significantly Differentially Expressed Genes Under Zn and Cu Stress
The percentages of annotated genes were 28.43% in KOG, 57.59% in GO, and 8.01% in KEGG (Figure 1). When compared with results for group C, 6121 genes and 7568 transcripts with significant differences were screened from group A, including 5941 and 7256 upregulated genes and transcripts and 180 and 312 downregulated genes and transcripts, respectively (Figure 2a). Additionally, levels of 7975 genes and 10011 transcripts differed significantly between groups C and B, among which 7907 genes and 9764 transcripts were upregulated and 68 genes and 247 transcripts were downregulated in group B (Figure 2b). In total, 1352 genes and 1408 transcripts differed significantly between groups A and B, among which 17 genes and 79 transcripts were upregulated and 1335 genes and 1329 transcripts were downregulated in group B (Figure 2c). Under Cu stress, the activated genes (FC ≥ 20) were mainly enriched for protein synthesis, REDOX reaction, and copper chaperone (Table 5), which might owing to that Cu toxicity arises from catalyzing the formation of ROS via Fenton-like reactions or substitution for Fe-S clusters . The activated genes under Zn stress (FC ≥ 20) were mainly enriched for zinc ion transport and REDOX and those with FC ≤ --18 were mainly related to zinc ion transport (Table 6). Most differentially expressed genes were upregulat ed, and only a few were downregulated under Zn or Cu stress, indicating that A. niger actively responded to Zn and Cu stres s by increasing the expression of related genes to maintain normal functions and physiology The adsorption-tolerance synergy i the main resistance mechanism niger under heavy metal stress .
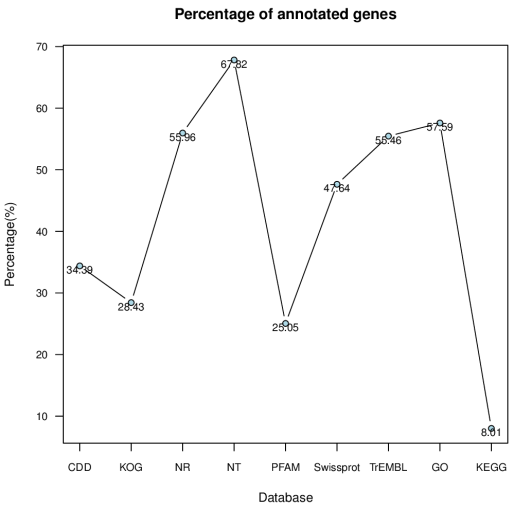
Figure 1. Percentage of annotated genes in different database.
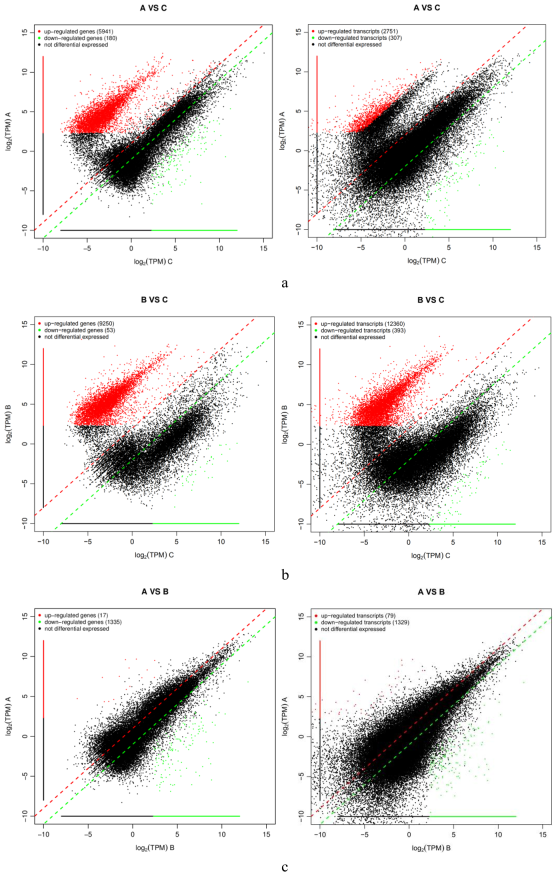
Figure 2. The differential genes under Zn and Cu (qValue<0.05 and |FoldChange|>2).
(a represents the different genes and transcripts of A vs C, b represents the different genes and transcripts of B vs C, c represents the different genes and transcripts of A vs B.)
Table 5. Differential gene expression under Cu stress (FC ≥ 20 or ≤ -18).

Gene id

Mean TPM (B)

Mean TPM (C)

log2 fold change

q-Value

Direction

Function (KOG/GO/TrEMBL)

TRINITY_DN37137 _c4_g3

1403.40 39

0.0001

23.74242701

3.54E- 07

up

Ubiquitin/60S ribosomal protein L40 fusion

TRINITY_DN35856 _c0_g4

951.091 7

0.0001

23.18115305

4.12E- 08

up

Thioredoxin

TRINITY_DN37465 _c0_g1

808.478 8

0.0001

22.94677842

4.82E- 14

up

Uncharacterized protein OS=Aspergillus oryzae

TRINITY_DN37095 _c0_g2

550.070 3

0.0001

22.39118467

3.07E- 06

up

Ubiquitin/40S ribosomal protein S27a fusion

TRINITY_DN36195 _c1_g9

484.202 3

0.0001

22.20717853

9.74E- 08

up

Copper chaperone

TRINITY_DN35384 _c0_g2

369.312 2

0.0001

21.81640975

1.55E- 05

up

Molecular chaperones HSP70/HSC70, HSP70 superfamily

TRINITY_DN35885 _c2_g7

307.329 4

0.0001

21.55135425

5.65E- 06

up

Ubiquitin/60s ribosomal protein L40 fusion

TRINITY_DN37185 _c0_g3

306.433 1

0.0001

21.54714087

1.28E- 07

up

NADH:flavin oxidoreductase/12- oxophytodienoate reductase

TRINITY_DN35247 _c0_g4

294.128 3

0.0001

21.48801433

0.0005

up

Glutaredoxin and related proteins

TRINITY_DN37215 _c0_g1

272.012 3

0.0001

21.37524034

2.79E- 07

up

/

TRINITY_DN32067 _c0_g1

271.879

0.0001

21.37453329

0.0006

up

1-Acyl dihydroxyacetone phosphate reductase and related dehydrogenases

TRINITY_DN36707 _c0_g1

235.113 7

0.0001

21.16492701

3.37E- 07

up

Molecular chaperones HSP70/HSC70, HSP70 superfamily

TRINITY_DN36887 _c2_g4

222.361

0.0001

21.08447234

3.16E- 06

up

Molecular chaperone (small heat-shock protein Hsp26/Hsp42)

TRINITY_DN58047 _c0_g1

0.0001

37.9444

-

18.53352746

0.0111

down

Subtilisin kexin isozyme-1/site 1 protease, subtilase superfamily

TRINITY_DN35446 _c3_g1

0.0001

52.9275

-

19.01365799

0.0115

down

Integral membrane component

Table 6. Differential gene expression under Zn stress (FC ≥ 20 or ≤ -18).

Gene id

Mean TPM (A)

Mean TPM (C)

log2 fold change

q-Value

Direction

Function

TRINITY_DN37048_ c0_g2

427.7188

0.0001

22.0282

2.60E- 09

up

Uncharacterized protein

TRINITY_DN24487_ c0_g1

379.4474

0.0001

21.8556

2.60E- 09

up

/

TRINITY_DN35247_ c0_g4

313.9668

0.0001

21.5822

2.72E- 06

up

/

TRINITY_DN37802_ c1_g1

181.5296

0.0001

20.7918

8.50E- 09

up

Zn2+ transporter ZNT1 and related Cd2+/Zn2+ transporters (cation diffusion facilitator superfamily)

TRINITY_DN36989_ c0_g9

158.1992

0.0001

20.5933

3.26E- 08

up

oxidoreductase activity, acting on paired donors, with incorporation or reduction of molecular oxygen

TRINITY_DN36642_ c0_g6

111.8162

0.0001

20.0927

3.08E- 08

up

oxidoreductase activity, acting on paired donors, with incorporation or reduction of molecular oxygen

TRINITY_DN36908_ c0_g3

110.6152

0.0001

20.0771

1.65E- 07

up

/

TRINITY_DN25819_ c0_g1

105.5342

0.0001

20.0093

2.36E- 08

up

oxidoreductase activity, acting on paired donors, with incorporation or reduction of molecular oxygen

TRINITY_DN37305_ c0_g12

104.8678

0.0001

20.0001

2.36E- 07

up

zinc ion binding/oxidoreductase activity

TRINITY_DN17316_ c0_g2

0.0001

27.6384

-18.0763

0.0353

down

cytoplasm/L-amino acid transmembrane transporter activity

TRINITY_DN37431_ c0_g3

0.0001

32.7865

-18.3227

0.0169

down

ribonuclease III activity/RNA binding/RNA processing

TRINITY_DN22007_ c0_g1

0.0001

50.1727

-18.9365

9.06E- 05

down

integral membrane component

TRINITY_DN35446_ c3_g1

0.0001

52.9275

-19.0137

0.0002

down

integral membrane component

TRINITY_DN25218_ c0_g1

0.0001

122.6521

-20.2261

0.0002

down

/

TRINITY_DN14417_ c0_g1

0.0001

192.1176

-20.8736

8.44E- 05

down

Unnamed protein product OS

TRINITY_DN53309_ c0_g1

0.0001

861.5829

-23.03856

2.69E- 06

down

/

Table 7. Verified differentially expressed genes.

Gene id

Mean TPM (A)

Mean TPM (B)

Mean TPM (C)

log2 fold change

Q-Value

Result 1

Result 2

TRINITY_DN36226_c3_g1

911.3373

2.4437

/

8.5428

2.67E-06

up

up

TRINITY_DN37865_c1_g4

1602.097 9

5.7960

/

8.1107

6.89E-06

up

up

TRINITY_DN37487_c0_g1

2.6218

187.8221

/

-6.1627

0.0093

down

up

TRINITY_DN27566_c0_g1

1.8571

564.1446

/

-8.2469

0.0010

down

down

TRINITY_DN30178_c0_g1

23.8624

0.0001

/

17.8644

1.0000

up

up

TRINITY_DN37711_c1_g5

42.2521

0.0001

/

18.6887

2.13E-07

up

up

TRINITY_DN37502_c0_g5

43.4822

0.0001

/

18.7301

5.95E-05

up

up

TRINITY_DN35627_c0_g10

37.0141

0.0001

/

18.4977

1.05E-05

up

up

TRINITY_DN34499_c2_g1

16.9937

0.0001

/

17.3746

1.17E-06

up

up

TRINITY_DN35404_c2_g3

/

3222.3667

10.8374

8.2160

0.0006

up

down

TRINITY_DN37634_c1_g1

/

829.3407

4.3637

7.5703

0.0009

up

up

TRINITY_DN35878_c1_g1

/

6.2588

766.4338

-6.9361

0.0109

down

down

TRINITY_DN35561_c1_g1

/

6.3221

647.0381

-6.6773

0.0207

down

up

TRINITY_DN35178_c3_g1

/

91.5329

0.0001

19.8040

5.84E-06

up

up

TRINITY_DN37809_c0_g5

/

77.7409

0.0001

19.5683

2.93E-06

up

up

TRINITY_DN37260_c1_g3

/

53.6735

0.0001

19.0339

1.29E-06

up

up

TRINITY_DN36124_c2_g8

/

17.6184

0.0001

17.4267

0.0001

up

up

TRINITY_DN37249_c1_g12

/

29.7571

0.0001

18.1829

7.20E-06

up

up

TRINITY_DN37780_c0_g1

/

300.2814

7.8724

5.2534

0.0005

up

up

TRINITY_DN37780_c0_g1

15.8333

/

300.2814

-4.2453

0.0046

down

down

TRINITY_DN37749_c2_g8

5.7350

/

60.45897

-3.3981

0.0498

down

down

TRINITY_DN33158_c0_g1

2.3459

/

18.7670

-2.9999

0.0405

down

up

TRINITY_DN30925_c0_g1

2.0546

/

223.2975

-6.7640

0.0004

down

down

TRINITY_DN35913_c0_g2

315.0660

/

3.0729

6.6800

0.0264

up

down

TRINITY_DN37504_c2_g1

0.0001

/

241.8143

-21.2055

7.26E-07

down

down

TRINITY_DN21185_c0_g1

0.0001

/

95.4216

-19.8640

3.05E-06

down

down

TRINITY_DN35275_c1_g2

0.0001

/

117.9133

-20.1693

7.53E-06

down

down

TRINITY_DN36707_c0_g1

0.0001

/

235.1137

-21.1650

5.16E-07

down

down

Note: A represents samples under Zn stress, B represents samples under Cu stress, and C represents the controls.
Result 1 refers to the transcriptome sequencing results, while Result 2 refers to the qRT-PCR verification results. qRT-PCR, quantitative reverse transcription-polymerase chain reaction
3.3. Comparison of Differentially Expressed Genes Under Zn and Cu Stress
3.3.1. Characteristics of Gene Expression Under Zn Stress
Significantly differentially expressed genes were enriched for various terms in the GO database. Differentially expressed genes in A vs. C were mainly enriched in the following GO terms: cytoplasmic part, intracellular part, intracellular membrane-bound, intracellular organelle, cytoplasm, cell, intracellular, and cytosol (Figure 3a). Using KOG, there was significant enrichment for the terms RNA processing and modification, cell cycle control, cell division, chromosome partitioning, unknown function, replication, recombination and repair, amino acid transport, and metabolism (Figure 3b).
In A vs. C, no downregulated genes were significantly enriched in the biological processes category (q<0.001). It total, 54 significantly downregulated genes were enriched for the term membrane part in the cellular component category (q = 0.0042), indicating roles in integral and intrinsic components of the membrane (Figure 3c), including the regulation of the membrane channels of Zn ions and membrane proteins involved in Zn ion transport. Additionally, 74 significantly down-regulated genes were enriched for the term catalytic activity in the molecular function category (q = 0.5531), indicating a role in the regulation of double-stranded RNA-specific ribonuclease activity and ribonuclease III activity (Additional File 2). These findings imply that Zn induced damage in A. niger cell via two mechanisms: (1) the membrane structure of cells was affected to prevent Zn from entering cells and (2) ribonuclease activity was affected, preventing the hydrolysis of nucleic acids. The mechanism underlying resistance to Zn was observed at the molecular level. In the biological processes category, 3295, 2864, and 1239 upregulated genes were enriched for the terms cellular process (q = 0.0003), metabolic process (q = 0.0065), and cellular component organization or biogenesis (q = 0.0248), respectively. In the cellular component category, 3735, 3725, 1331, 3122, and 1957 upregulated genes were enriched for the terms cell, cell part, macromolecular complex, organelle, and organelle part (q = 0.0000), excluding nuclear replication fork, protein complex, mating projection, and mitochondrial ribosome, etc. In the molecular function category, 2544 upregulated genes were enriched for the term catalytic activity (q = 0.0016), indicating roles in processes related to RNA binding, nucleic acid binding, nuclease, ribonuclease, endonuclease, and endoribonuclease activity (Figure 3d). The upregulated genes were beneficial for DNA replication and protein synthesis.
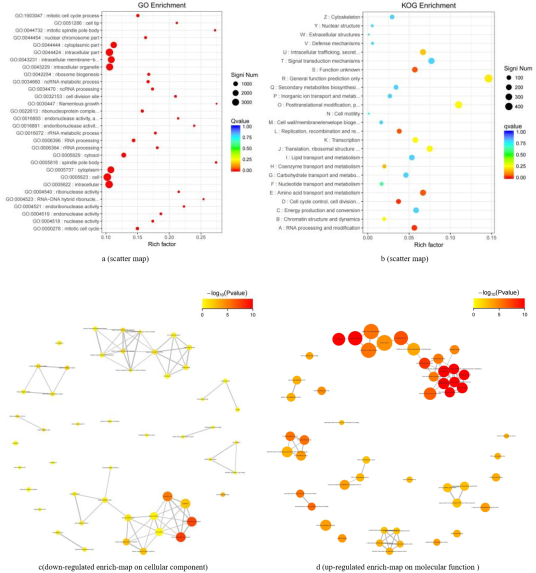
Figure 3. The enrichment of the differential genes (Go database) (A vs C).
In a KEGG enrichment analysis, the upregulated genes were mainly involved in three pathways, DNA replication, aminoacyl- tRNA biosynthesis, and ribosome biogenesis in eukaryotes (Figure 4a), concentrated in the category of genetic information processing and protein synthesis. Genes related to the metabolism of carbohydrates and energy were not upregulated. These findings confirmed that A. niger achieved resistance to Zn via the promotion of a wide range of biological processes, especially DNA replication and RNA and protein synthesis. The downregulated genes were significantly enriched in styrene, chloroalkane and chloroalkene, chlorocyclohexane and chloroalkene, dioxin, polycyclic aromatic hydrocarbon degradation, β - alanine, and tyrosine metabolism pathways (Figure 4b). The downregulated genes were involved in the metabolism of toxic substances, β-alanine, and tyrosine, indicating the reduced activity of enzymes involved in biochemical reactions under Zn stress. Tyrosine plays an important role in the protein surface and binding interface; the reduction in this metabolic pathway may cause a decline in membrane protein function. Additionally, β-alanine plays important roles in cell metabolism, energy, the maintenance of an acid-alkali balance, regulate protein synthesis, and other processes.
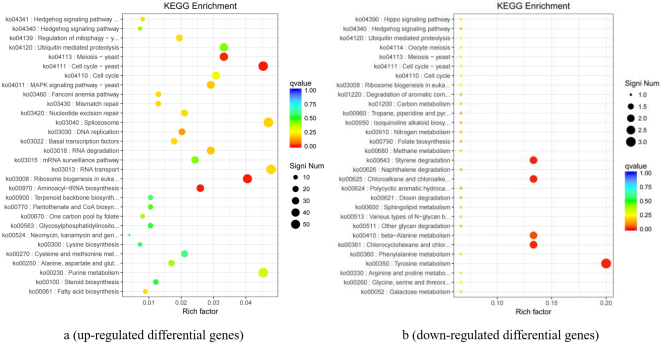
Figure 4. The enrichment of the differential genes (KEGG database)(A vs C).
3.3.2. Characteristics of Gene Expression Under Cu Stress
Significantly differentially expressed genes between groups B and C were mainly enriched for the terms post-translational modification, protein turnover, chaperones; intracellular trafficking, secretion, and vesicular transport; energy production and conversion; and cell cycle control, cell division, chromosome partitioning according to the KOG mapping results (Figure 5a). Downregulated genes under Cu stress were enriched for the terms, ion transport, Cu ion transport and Cu ion import in the biological process category (Figure 5b), membrane part, intrinsic component of membrane, integral component of membrane in the cellular component category (Figure 5c), and ferric-chelate reductase and oxidoreductase activity in the molecular function category (Figure 5d). The downregulation of these genes suggests that A. niger maintains intracellular Cu ion homeostasis by changing the membrane structure and reducing the transport of Cu ions to limit input; excess Cu ions are bound to proteins during the tricarboxylic acid cycle, inducing the heteromerization of these proteins, resulting in reduced activity of iron-containing reductase . Physiological processes, such as energy metabolism, organic degradation, and antioxidant defense, were affected by Cu-ion stress in A. niger.
(a-the significantly differential genes in KOG; b,c,d- the down-regulated significantly differential genes in GO)

Download: Download full-size image

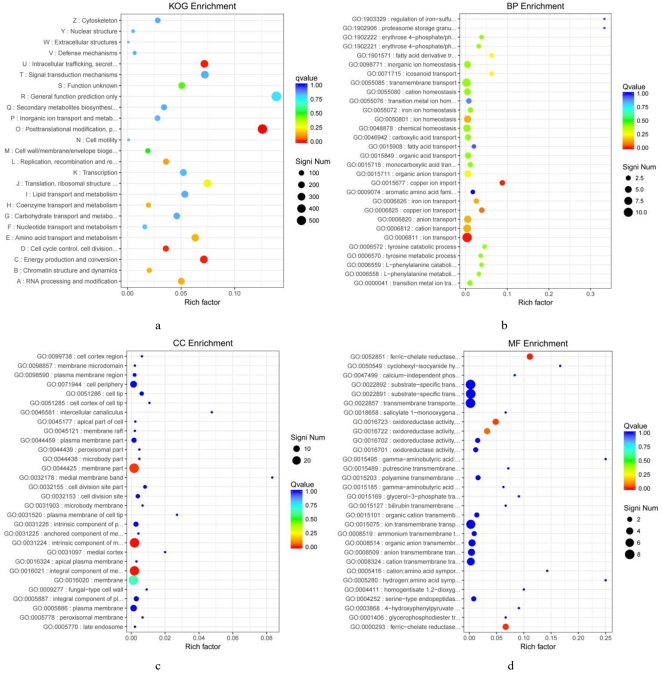
Figure 5. The enrichment of the significantly differential genes (B vsC).
Most of the significantly differentially expressed genes in A. niger were upregulated. In the biological process category, 4203 upregulated genes were associated with cellular processes (q = 0.0182) and 3665 upregulated genes were associated with metabolic processes (q = 0.0065). In the cellular component category, 4794 upregulated genes were associated with the term cell (q = 0.0000), 4783 upregulated genes were related to the term cell part (q = 0.0000), 1647 upregulated genes were associated with the term macromolecular complex (q = 0.0000), 3982 upregulated genes were related to the term organelle (q = 0.0000), and 2441 upregulated genes were related to the term organelle part (q = 0.0000). In the molecular function category, 3228 upregulated genes were associated with the term metallochaperone activity (q = 0.0002) (Additional File 3). In a KEGG analysis, the upregulated genes were mainly involved in the protein processing pathway in the endoplasmic reticulum, proteasome, RNA transport, ribosome biogenesis in eukaryotes, and aminoacyl-tRNA biosynthesis. The upregulated genes were mainly involved in pathways related to cellular processes, environmental information processing, genetic information processing, and metabolism. The species tolerates Cu ion toxicity by improving growth, division, protein synthesis, and metabolism (matter and energy) (Figure 6a). Only one downregulated gene was involved in each of the Hippo and Hedgehog signaling pathways, styrene degradation, tyrosine metabolism, and oxidative phosphorylation pathways (Figure 6b). Copper is an important trace element that exists in oxidizing and reducing forms and is involved in various biological processes, including redox reactions, enzyme reactions, mitochondrial respiration, iron metabolism, autophagy, and immune regulation. Therefore, maintaining the homeostasis of Cu ions is essential for organisms, as both insufficient and excess Cu can have adverse effects.
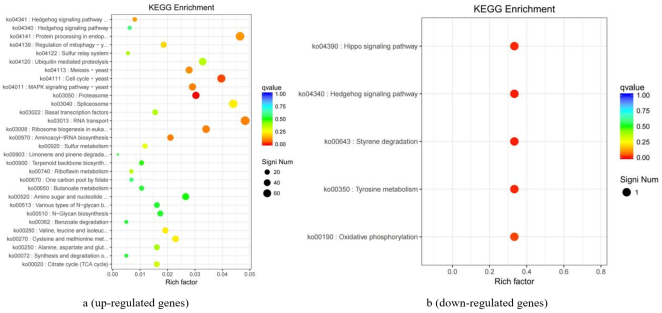
Figure 6. The enrichment of the differential genes (KEGG database) (B vs C).
3.3.3. Comparison of Gene Expression Characteristics Between Zn and Cu Stress
Differentially expressed genes between groups A and B were enriched for the terms post-translational modification, protein turnover, chaperones, energy production and conversion, intracellular trafficking, secretion, and vesicular transport according to KOG (Figure 7a). In a GO analysis, differentially expressed genes were mainly enriched for the terms cytoplasmic part, cytoplasm, mitochondrial part, envelope, organelle envelope, mitochondrial membrane, organelle inner membrane, mitochondrion, mitochondrial envelope, and mitochondrial inner membrane. The differentially expressed genes were also involved in mitochondrial structure, protein synthesis, ion transportation, and energy production and conversion.
Downregulated genes in B compared with A (q < 0.05) were not enriched for terms in the biological process and cellular component categories. In the molecular function category, 19 downregulated genes (q = 0.0247) were enriched for electron carrier activity, and 16 downregulated genes (q = 0.0582) were enriched for antioxidant activity (Additional File 4). Upregulated genes (q < 0.05) were not enriched for any terms in the three main categories, biological processes, cellular components, or molecular functions, in a GO analysis.
In the biological process category, genes that were down-regulated but did not show significant differences were mainly enriched on the following terms: protein fold, protein transmembrane transport, mitochondrial transmembrane transport, intracellular transmembrane transport and protein transmembrane import into intracellular organelle (Figure 7b). For the cellular component category, the downregulated genes were mainly enriched for the terms respiratory chain, mitochondrial part, composition and structure of mitochondrion, membrane protein complex, proteasome complex, endopeptidase complex and peptidase complex (Figure 7c). The downregulated genes were enriched for the following terms in the molecular function category: threonin-type endopeptidase activity, threonine-type peptidase activity, oxidoreductase activity, oxidoreductase activity (acting on a sulfur group of donors), and oxidoreductase activity (acting on NADPH) (Figure 7d). In the responses to Zn and Cu stress, genes involved in mitochondria and proteases associated with respiration were inhibited, as was the activity of enzymes involved in protein breakdown and energy production. Additionally, the transport of cell substances was inhibited under Zn stress.
(a- the significantly differential genes in KOG; b,c,d- the down-regulated significantly differential genes in GO)

Download: Download full-size image

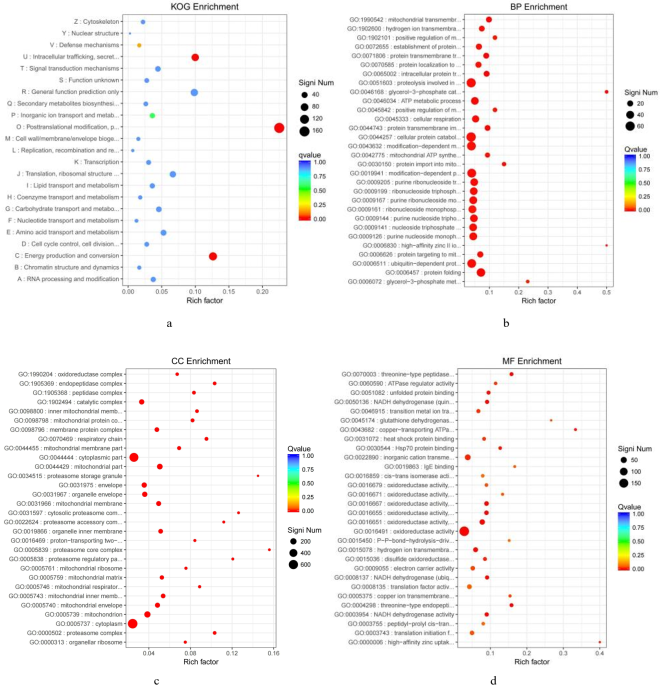
Figure 7. The enrichment of the significantly differential genes (A vs B).
In the KEGG enrichment analysis, upregulated genes were not enriched in any pathway, except carbohydrate metabolism and xenobiotic biodegradation and metabolism under Zn stress. Effects on these two pathways were stronger under Zn stress than under Cu stress (Figure 8a), implying that carbohydrate metabolism improved and exogenous toxic substances were broken down by A. niger to a greater extent under Zn stress than under Cu stress. The response of A. niger to Cu stress was more positive than that under Zn stress, which may be explained by the role of Cu in many biochemical reactions and the higher toxicity of Cu than Zn. Downregulated genes were not enriched in membrane transport, signaling molecule, or interaction pathways under Zn stress; however, there was enrichment for these terms under Cu stress. There were fewer downregulated genes involved in cell growth and death, cell motility, cellular community, signal transduction, replication and repair, lipid metabolism, xenobiotic biodegradation, and metabolism pathways under Zn stress than under Cu stress; however, there were more downregulated genes involved in folding sorting and degradation, carbohydrate metabolism, energy metabolism, and overview pathways under Zn stress than under Cu stress (Figure 8b). These results showed that the energy consumption of A. niger under Cu stress was greater than that under Zn stress for the bigger toxic effects of Cu , and the upregulation of bot h carbohydrate and energy metabolism pathways is not conducive to organic carbon storage in heavy metal-polluted environme nts .
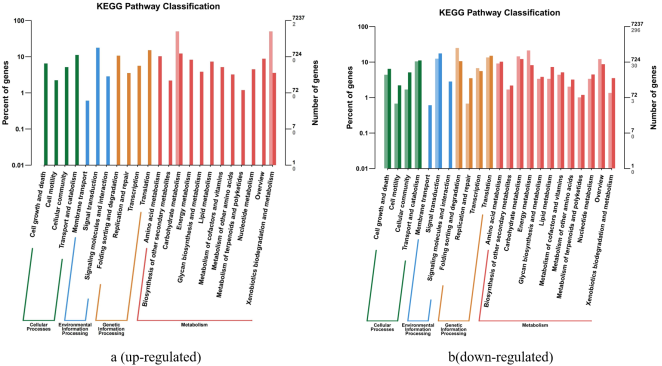
Figure 8. The enrichment of the down-regulated differential genes (KEGG database) (Avs B).
3.3.4. qRT-PCR Verification
qRT-PCR results are shown in Table 7. The results for 23 genes obtained using qRT-PCR were identical to those of the transcriptomics analysis (82.14%). Only 5 genes showed differences between qRT-PCR and transcriptomics analyses. These differences could be explained by the experimental operation, sample processing, primer designation, data processing and analysis, and selection of genes. For two genes showed inconsistent results, DN33158_c0_g1 (q = 0.0405) and DN35913_c0_g2 (q = 0.0264), the differences between groups may have been insufficient. Genes with larger fold-changes and smaller q-values should be selected for qRT-PCR verification experiments.
This study provides a perspective on the tolerance of Aspergillus niger to heavy metals from the genetic level. Genetic mechanismsun derlying differences in Aspergillus niger tolerance to different heavy metals were identified. Although most functional genes were upregulated (and few were downregulated) in response to both Cu and Zn stress, the functions of the upregulated and do wnregulated genes differed, and A. niger was more active in response to Cu stress than to Zn stress.
The downregulated genes were associated with organelles with membrane structure and ion transportation, and the upregulated genes were mainly related to the synthesis of proteins under both Zn and Cu stress.
A. niger tolerates copper and zinc stress in different ways. Under Zn stress, signal transduction and hydrolysis of nuclei c acids were inhibited; cell growth, division, and metabolism of carbohydrates and energy were improved under Cu stress.
Genes involved in the metabolism of carbohydrates and energy production were more highly expressed under Cu stress than under Zn stress, and the consumption of energy was higher under Cu stress than under Zn stress in A. niger. The key genes should be confirmed through experiment in future. The study of the microbial commu nity structure, respiration and carbon pool in heavy metal contaminated soil is worthy of in-depth investigation.
Abbreviations

NCBI

The National Center for Biotechnology Information

CASAVA Base Calling

Cluster Analysis and Base Calling Application

CDD

Conserved Domain Database

TrEMBL

Translation of EMBL Nucleotide Sequence Database

Swiss-Prot

Swiss Protein Sequence Database

CDS

Coding Sequence

RSeQL

Realizability Semantics Query Language

Acknowledgments
This research was supported by the financial support received from the National Natural Science Foundation of China (52304421), Major Project of Changsha Science and Technology Planning Project (kh2301012), Natural Science Foundation of the Environmental Protection Department of Hunan Province (HBKF2022004), and Research Foundation of the Department of Natural Resources of Hunan Province (Grant No. 20230141ST).
Conflicts of Interest
There is no conflicts of interest.
References
[1] Loa, JDA, Cruz-Rodríguez, IA, Rojas-Avelizapa, NG (2023) Colorimetric detection of metals using CdS-NPs synthesized by an organic extract of Aspergillus niger.Appl. Biochem. Biotechnol. 195, 4148.
[2] Nurdin, M Mulkiyan L, Sugiwati S, Abimayu H, Arifin ZS, Muryanto M, Maulidiyah M, Arham Z, Salim LOA, Irwan I (2023) Productivity of Aspergillus niger InaCC F57 isolate as cellulase agent in OPEFB hydrolysis for glucose high yield. BioNanoScience 13, 114.
[3] Wu L, Zhang L, Li X, Lv R, Cao W, Gao W, Liu J, Xie Z, Liu H(2023) Effective production of kojic acid in engineered Aspergillus niger. Microb. Cell Factories 22, 40.
[4] Amin I, Nazir R, Rather MA (2024) Evaluation of multi-heavy metal tolerance traits of soil-borne fungi for simultaneous removal of hazardous metals. World J. Microbiol. Biotechnol. 40, 175.
[5] El-Mahdy OM, Mohamed HI, Mogazy AM (2021) Biosorption effect of Aspergillus niger and Penicillium chrysosporium for Cd- and Pb-contaminated soil and their physiological effects on Vicia faba L. Environ. Sci. Pollut. Res. Int. 28, 67608.
[6] Xia YT, Guo Q, Qin NN, Tang Y. Tan QJ, Sun HJ, Gao YT, Guo Q, Zhou G(2019) Preparation of Aspergillus niger mycelium-chitosan and study on the adsorption performance of Cr(VI.). Mod. Food Sci. Technol. 35, 68.
[7] Wei BY, Gao GF, Tian Y, Lu XY, Cao L, Li SX,(2011) Decoloring properties of Aspergillus niger to rose bengal and water-soluble color paste. Acta Sci. CIrcumstantiae 31, 492.
[8] Cui H, Liu X, Li K, Cao TT, Cui CW, Wang JY (2019) Mechanism of Hg(II), Cd(II) and Pb(II) ions sorption from aqueous solutions by Aspergillus niger spores. Sep. Sci. Technol. 55, 848.
[9] Deng XH, Chen RH, Zhuo SN, Zhou GY, Shi Y(2019) Bioleaching characteristics of heavy metals from polluted soil with indigenous Aspergillus niger F2. J. Biobased Mater. Bioenergy 13, 401.
[10] Arshadi M, Esmaeili A, Yaghmaei S(2020) Investigating critical parameters for bioremoval of heavy metals from computer printed circuit boards using the fungus Aspergillus niger. Hydrometallurgy 197, 105464.
[11] Bahaloo-HorehN, Mousavi SM, Baniasadi M (2018) Use of adapted metal tolerant Aspergillus niger to enhance bioleaching efficiency of valuable metals from spent lithium-ion mobile phone batteries. J. Cleaner Prod. 197, 1546.
[12] Nguyen TH, Won S, Ha MG, Nguyen DD, Kang HY (2021) Bioleaching for environmental remediation of toxic metals and metalloids: A review on soils, sediments, and mine tailings. Chemosphere 282, 131108.
[13] Hajihoseini J, Fakharpour M (2019) Effect of temperature on bioleaching of iron impurities from kaolin by Aspergillus niger fungal. J. Asian Ceram. Soc. 7, 82.
[14] Kiskira K, Theopisti L, Ioannis L, Lamprini AT, Charalampos P, Konstantina P, Klaus MO, Fotios T, Elias C, · Gerasimos L, Maria OP,(2023) Bioleaching of scandium from bauxite residue using fungus Aspergillus Niger. Waste Biomass Valorization 14, 3377.
[15] Deng XH, Chen RH, Shi Y, Zhuo SN (2018) Preliminary bioleaching of heavy metals from contaminated soil applying Aspergillus niger. Am. J. Environ. Sci. Eng. 2, 72.
[16] Ren WX, Li PJ, Geng Y, Li XJ (2009) Biological leaching of heavy metals from a contaminated soil by Aspergillus niger. J. Hazard. Mater. 167, 164.
[17] Srichandan H, Mohapatrab RK, Parhib PK, Mishraa S (2019) Bioleaching approach for extraction of metal values from secondary solid wastes: A critical review. Hydrometallurgy 189, 105122.
[18] Tripathi S, Poluri KM (2021) Heavy metal detoxification mechanisms by microalgae: Insights from transcriptomics analysis. Environ. Pollut. 285, 117443.
[19] Voigt K, Sharma CM, Mitschke J, Lambrecht SJ, Voß B, Hess WR, Steglich C (2014) Comparative transcriptomics of two environmentally relevant cyanobacteria reveals unexpected transcriptome diversity. ISME J. 8, 2056.
[20] Sun S, Wang Y, He B, Chen J, Leng F, Luo W (2024) Comparative transcriptomics revealed the mechanism of Stenotrophomonas rhizophila JC1 response and biosorption to Pb2+. Environ. Geochem. Health 46, 231.
[21] Wang W, Yan H, Dong G, Li Z, Jiang C, Gu D, Niu D, Zhou D, Luo Y(2022) Comparative transcriptomics reveal different genetic adaptations of biofilm formation in Bacillus subtilis isolate 1JN2 in response to Cd2+ treatment. Front. Microbiol. 13, 1002482.
[22] Kwon MJ, Jørgensen TR, Nitsche BM, Arentshorst M, Park J, Ram AFJ, Meyer V (2012) The transcriptomic fingerprint of glucoamylase over-expression in Aspergillus niger. BMC Genomics 13, 701.
[23] Wang L, Xie Y, Chang J, Wang J, Liu H, Shi M, Zhong Y(2023) A novel sucrose-inducible expression system and its application for production of biomass-degrading enzymes in Aspergillus niger. Biotechnol. Biofuels Bioprod. 16, 23.
[24] Pullan ST, Paul D, Stéphane D, Roger I, Matthew K, Almar N,Jolanda M van M, Raymond W, Martin JB, Sanyasi G, Gregory AT,David BA(2014) RNA-sequencing reveals the complexities of the transcriptional response to lignocellulosic biofuel substrates in Aspergillus niger. Fungal Biol. Biotechnol. 1, 3.
[25] van Munster JM, Jolanda M, van M, Paul D, Stéphane D, Steven TP, Martin JB, Sunir M, Matthew K, Emelie CMN, Kristin W, Richard F, Richard B, Yu XL, Paul D, David BA(2014) The role of carbon starvation in the induction of enzymes that degrade plant- derived carbohydrates in Aspergillus niger. Fungal Genet. Biol. 72, 34.
[26] Novodvorska M, Hayer K, Pullan ST, Wilson R, Blythe MJ, Stam H, Stratford M, Archer DB (2013) Transcriptional landscape of Aspergillus niger at breaking of conidial dormancy revealed by RNA-sequencing. BMC Genomics 14, 246.
[27] Dubey S, Shri M, Gupta A, Rani V, Chakrabarty D (2018) Toxicity and detoxification of heavy metals during plant growth and metabolism. Environ. Chem. Lett. 16, 1169.
[28] Benjamini Y, Hochberg Y (1995) Controlling the false discovery rate: a practical and powerful approach to multiple testing. J. R. Stat. Soc. B 57, 289.
[29] Livak KJ, Schmittgen TD (2001) Analysis of relative gene expression data using real-time quantitative PCR and the 2−ΔΔCT method. Methods 25, 402.
[30] Macomber L, Imlay JA (2009) Theiron-sulfur clusters of dehydratases are primary intracellular targets of copper toxicity. Proc Natl Acad SciUSA 106, 8344-9.
[31] Liu J, Tan D, Qiu H, Liang Y, Wu H, Yang Y, Zhao H (2025) Unraveling the stress response and biosorption mechanisms of Aspergillus nigerto rare earth element cerium(III) based on transcriptomics and DNA methylomics. Front. Microbiol. 16, 1674444.
[32] Chatterjee S, Das S (2022) Whole-genome sequencing of biofilm-forming and chromium-resistant mangrove fungus Aspergillus niger BSC-1. World J. Microbiol. Biotechnol. 39, 55.
[33] Shi YX, Tang LY, Shao Q, Jiang YZ, Wang ZJ, Peng C, Gu TT, Li Z(2024) The dynamic roles of intracellular vacuoles in heavy metal detoxification by Rhodotorulamucilaginosa. J Appl Microbiol.135, lxae241.
[34] Xu YL, Balaji S, Nanthi B, Binoy S, Yong SO, Zhang W, Cornelia R, Donald S, Mark F, Tony H, Dong ZM (2019) Microbial functional diversity and carbon use feedback in soils as affected by heavy metals. Environ. Int. 125, 478.
Cite This Article
  • APA Style

    Chen, Y., Duan, Y., Xue, T., Deng, X. (2026). Comparative Transcriptomics Reveals the Molecular Mechanism Underlying Heavy Metal Detoxification in Aspergillus Niger. American Journal of Environmental Science and Engineering, 10(1), 1-20. https://doi.org/10.11648/j.ajese.20261001.11

    Copy | Download

    ACS Style

    Chen, Y.; Duan, Y.; Xue, T.; Deng, X. Comparative Transcriptomics Reveals the Molecular Mechanism Underlying Heavy Metal Detoxification in Aspergillus Niger. Am. J. Environ. Sci. Eng. 2026, 10(1), 1-20. doi: 10.11648/j.ajese.20261001.11

    Copy | Download

    AMA Style

    Chen Y, Duan Y, Xue T, Deng X. Comparative Transcriptomics Reveals the Molecular Mechanism Underlying Heavy Metal Detoxification in Aspergillus Niger. Am J Environ Sci Eng. 2026;10(1):1-20. doi: 10.11648/j.ajese.20261001.11

    Copy | Download

  • @article{10.11648/j.ajese.20261001.11,
      author = {Yingjie Chen and Yuyuan Duan and Tingfang Xue and Xinhui Deng},
      title = {Comparative Transcriptomics Reveals the Molecular Mechanism Underlying Heavy Metal Detoxification in Aspergillus Niger},
      journal = {American Journal of Environmental Science and Engineering},
      volume = {10},
      number = {1},
      pages = {1-20},
      doi = {10.11648/j.ajese.20261001.11},
      url = {https://doi.org/10.11648/j.ajese.20261001.11},
      eprint = {https://article.sciencepublishinggroup.com/pdf/10.11648.j.ajese.20261001.11},
      abstract = {Aspergillus niger shows resistance to Zn and Cu; however, limited studies have evaluated the genetic mechanisms underlying metal tolerance in the species. In this study, comparative transcriptome analyses of A. niger F2 under Zn (4000 mg/L) and Cu (3000 mg/L) stress for 15 days were performed to identify genes involved in the response to heavy metal stress. There were more upregulated than downregulated genes under both Cu and Zn stress; however, more genes were differentially expre ssed under Cu than under Zn stress. Downregulated genes under Zn stress were enriched mainly in the membrane part of the cellular component category and for catalytic activity of ribonucleases in the molecular function category. Downregulated genes under Cu stress were enriched for import of Cu ions in the biological process category, intrinsic membrane in the cellula r component category, and reductase and oxidoreductase activity in the molecular function category. Differentially express ed genes under Zn and Cu stress were enriched for different functional domains based on Gene Ontology and Kyoto Ency clopedia of Genes and Genomes analyses. These findings indicated that under heavy metal stress, downregulated genes are mainly involved in ion transport and cell membrane-related functions. Furthermore, energy consumption was higher under Cu stress than under Zn stress, contributing to differences in tolerance levels for A. niger. These findings provide a b asis for genetic engineering for efficient bioremediation.},
     year = {2026}
    }
    

    Copy | Download

  • TY  - JOUR
    T1  - Comparative Transcriptomics Reveals the Molecular Mechanism Underlying Heavy Metal Detoxification in Aspergillus Niger
    AU  - Yingjie Chen
    AU  - Yuyuan Duan
    AU  - Tingfang Xue
    AU  - Xinhui Deng
    Y1  - 2026/02/11
    PY  - 2026
    N1  - https://doi.org/10.11648/j.ajese.20261001.11
    DO  - 10.11648/j.ajese.20261001.11
    T2  - American Journal of Environmental Science and Engineering
    JF  - American Journal of Environmental Science and Engineering
    JO  - American Journal of Environmental Science and Engineering
    SP  - 1
    EP  - 20
    PB  - Science Publishing Group
    SN  - 2578-7993
    UR  - https://doi.org/10.11648/j.ajese.20261001.11
    AB  - Aspergillus niger shows resistance to Zn and Cu; however, limited studies have evaluated the genetic mechanisms underlying metal tolerance in the species. In this study, comparative transcriptome analyses of A. niger F2 under Zn (4000 mg/L) and Cu (3000 mg/L) stress for 15 days were performed to identify genes involved in the response to heavy metal stress. There were more upregulated than downregulated genes under both Cu and Zn stress; however, more genes were differentially expre ssed under Cu than under Zn stress. Downregulated genes under Zn stress were enriched mainly in the membrane part of the cellular component category and for catalytic activity of ribonucleases in the molecular function category. Downregulated genes under Cu stress were enriched for import of Cu ions in the biological process category, intrinsic membrane in the cellula r component category, and reductase and oxidoreductase activity in the molecular function category. Differentially express ed genes under Zn and Cu stress were enriched for different functional domains based on Gene Ontology and Kyoto Ency clopedia of Genes and Genomes analyses. These findings indicated that under heavy metal stress, downregulated genes are mainly involved in ion transport and cell membrane-related functions. Furthermore, energy consumption was higher under Cu stress than under Zn stress, contributing to differences in tolerance levels for A. niger. These findings provide a b asis for genetic engineering for efficient bioremediation.
    VL  - 10
    IS  - 1
    ER  - 

    Copy | Download

Author Information
  • School of Resource & Environment, Hunan University of Technology and Business, Changsha, China

  • School of Resource & Environment, Hunan University of Technology and Business, Changsha, China

  • School of Resource & Environment, Hunan University of Technology and Business, Changsha, China

  • School of Resource & Environment, Hunan University of Technology and Business, Changsha, China

  • Abstract
  • Keywords
  • Document Sections

    1. 1. Introduction
    2. 2. Materials and Methods
    3. 3. Results and Dicussion
    Show Full Outline
  • Abbreviations
  • Acknowledgments
  • Conflicts of Interest
  • References
  • Cite This Article
  • Author Information